
You are watching a crypto chart. The price is moving, candles are changing and a trading setup looks interesting. But what is happening beyond that one asset?
Are more cryptocurrencies moving in the same direction? Is market sentiment supporting the move? Are traders building new positions, closing existing ones or getting caught in liquidations?
A single chart shows the movement of one asset. The wider market can reveal the environment around it. This is the purpose of Cosmic.trade Insights, to bring key market signals into one view and help traders understand what is happening beyond an individual chart.
What Is Cosmic.trade Insights?
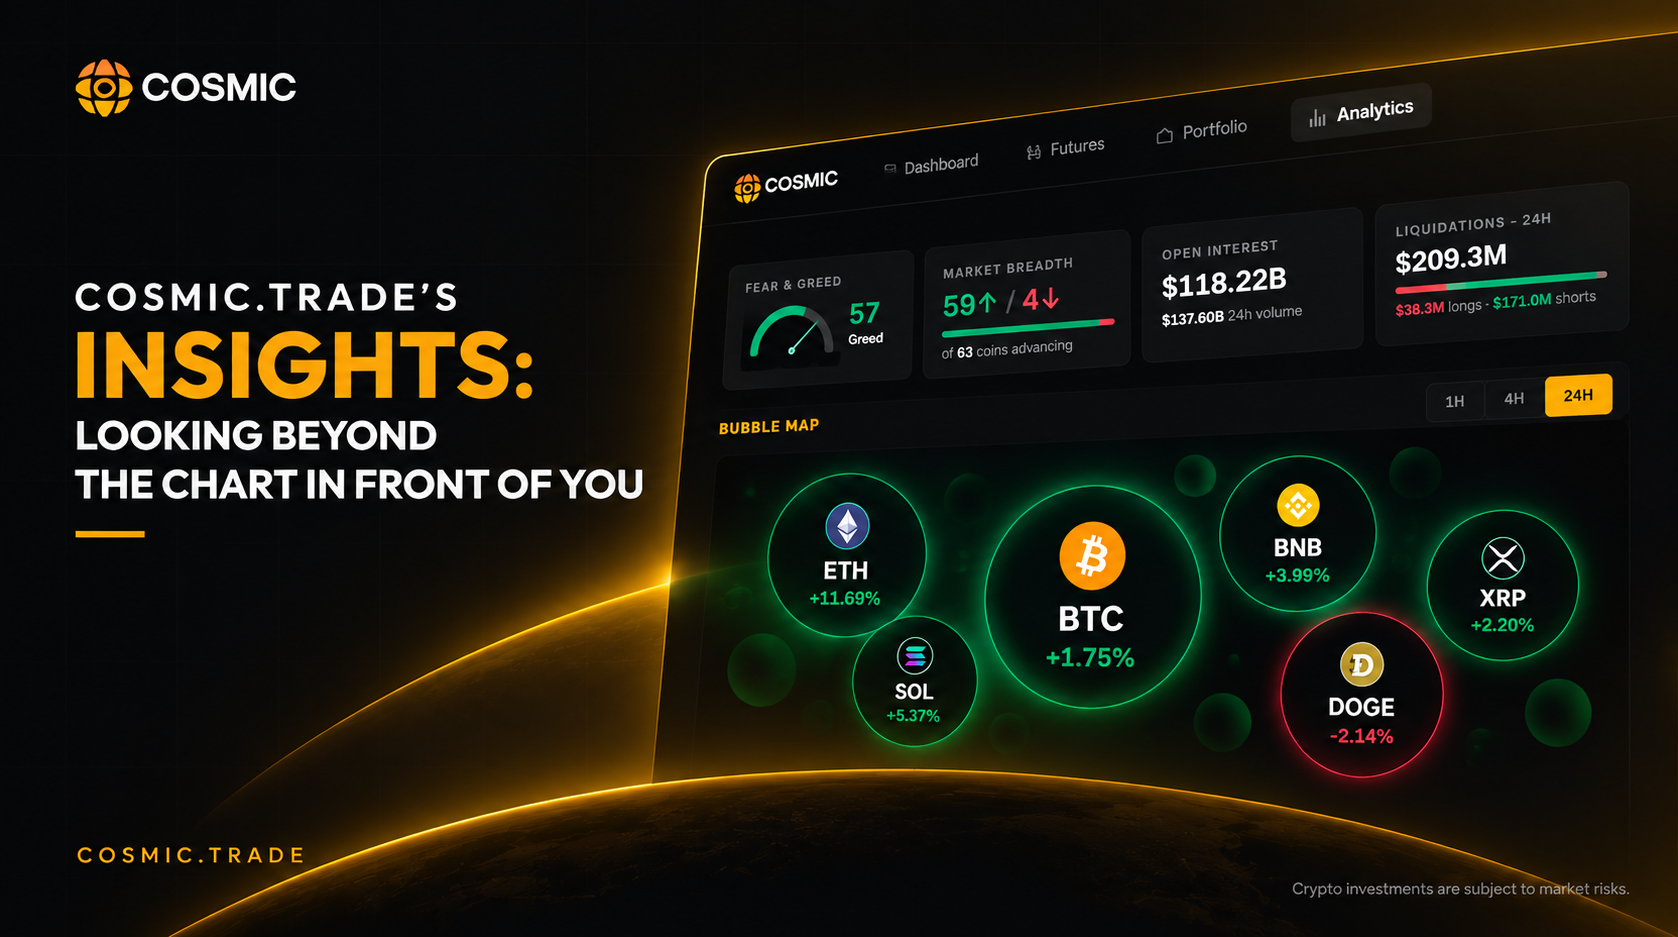
Cosmic.trade Insights is a market overview dashboard that combines market sentiment, breadth, market regime, derivatives activity and trader positioning.
Instead of switching between different tools to understand the wider market, traders can view important information through a single interface. The dashboard is designed to provide additional context before a trader evaluates an individual asset or trading setup.
The displayed data also includes an update time, refresh information and its data source. Since market conditions change quickly, these details help users understand that the information shown on the dashboard reflects a changing market environment.
Understanding the Market Indicators
The Insights dashboard brings several important indicators together.
Fear & Greed
The Fear & Greed indicator provides a quick view of broader market sentiment. It helps traders understand whether the market mood is leaning towards fear, greed or a more balanced position.
Sentiment can influence how traders respond to price movements. However, it should be viewed as market context rather than a standalone trading signal.
Market Breadth
Market Breadth shows how widely market movement is distributed across tracked cryptocurrencies.
This helps answer an important question: is the market movement being supported by a broad group of assets, or is it concentrated in only a few coins?
A wider market move and a move led by a small number of assets can present very different trading environments.
Market Regime
The Market Regime section provides a broader view of the current market environment. It helps traders understand whether the market is showing a clear trend or whether conditions appear less defined.
This can be useful when deciding how much importance to place on a particular price movement. A strong-looking setup may need to be evaluated differently in a clearly trending market compared with an uncertain one.
Open Interest
Open Interest reflects the outstanding positions in the derivatives market. The dashboard also displays trading-volume information, allowing users to view derivatives participation alongside market activity.
Open interest can help traders understand whether positions are being added or reduced. However, a rise in open interest does not automatically indicate a bullish or bearish outcome. It needs to be considered alongside price movement and other market signals.
Liquidations
The Liquidations indicator shows positions that have been forcibly closed because traders could not maintain the required margin.
Liquidation data can provide insight into market stress and sudden volatility. It may also help traders understand whether a sharp price move has affected long positions, short positions or both.
Global Long/Short Ratio
The Global Long/Short Ratio provides a view of how long and short positions are distributed in the displayed market data.
This can help traders understand market positioning and identify when sentiment may be heavily concentrated on one side. Positioning data, however, does not guarantee the direction of the next market move.
The Bubble Map: The Market at a Glance
One of the most visual sections of Cosmic.trade Insights is the Bubble Map.
The dashboard describes it as:
“The market at a glance, click any bubble to trade.”
Each bubble represents a cryptocurrency. The interface explains that size represents the magnitude of the move, while colour represents direction.
This makes it easier to compare several assets in one view instead of opening individual charts one by one. Positive and negative movements can be identified visually, while larger bubbles help draw attention to assets showing more significant movement under the selected view.
The Bubble Map can be explored through different timeframes and metrics. Users can change the view to compare:
- Price movement
- Open interest
- Trading volume
- Market capitalisation
The dashboard also provides category filters, allowing users to explore different areas of the crypto market.
This makes the Bubble Map useful not only for observing market-wide activity but also for narrowing attention to a particular category.
The Action Board: Price × Open Interest
Below the Bubble Map, Cosmic.trade Insights includes an Action Board titled:
“Price × Open Interest – who’s building, who’s leaving.”
The Action Board uses a long/short buildup framework to compare price movement with changes in open interest.
This helps traders look beyond whether an asset is simply rising or falling. By viewing price and open interest together, users can examine whether positions may be building, reducing or changing as the market moves.
It adds another layer of context to the dashboard and supports a more informed reading of derivatives activity.
Why Cosmic.trade Insights Matters
Cosmic.trade Insights does not replace chart analysis or risk management. Instead, it helps traders begin with a wider market view before focusing on an individual asset.
A trader can review sentiment, examine market breadth, observe open interest and liquidations, explore the Bubble Map and study the Action Board before returning to a detailed chart.
The value comes from connecting these signals rather than relying on one indicator alone.
Crypto markets rarely move in isolation. Price, sentiment, participation, derivatives activity and positioning all contribute to the market environment.
Cosmic.trade Insights brings these signals together so traders can look beyond the chart in front of them and understand more of the market around it.
Disclaimer: This article is for educational and informational purposes only. Crypto trading involves substantial risk, and market indicators do not guarantee future results.
Understand Margin. Watch the Distance.
A crypto futures position does not need to be closed to become risky.
The market may move against the trade while the position is still open. As that happens, the available margin can change, and the distance to liquidation may become smaller.
This is where many traders face a difficult situation: they know the position is under pressure, but they may not have a clear view of how much room is left.
Knowing that liquidation is possible is not the same as knowing how close the position is to liquidation.
Why Margin Health Matters
In futures trading, margin supports an open position. When the market moves against the trade, the position’s margin health can change.
A trader who only watches the entry price and unrealised profit or loss may miss another important question:
“How much room does this position have before liquidation becomes a concern?”
This is why live information matters while managing an open trade.
Isolated or Cross Margin: What Is Supporting the Position?
Cosmic.trade also supports isolated and cross margin.
These two margin modes determine how margin is allocated to positions:
- Isolated margin: margin is assigned to a specific position.
- Cross margin: available margin can be shared across positions according to the platform’s rules.
The choice affects how a trader’s available balance is connected to an open position. It should therefore be made with an understanding of the risks and the way margin is managed.
Neither margin mode removes liquidation risk.
What Happens When an Isolated Position Needs More Margin?
Consider a situation where an eligible isolated position is moving closer to liquidation, while the trader still has unused balance available.
This is where Cosmic.trade’s Auto Margin Top-Up becomes relevant.
When enabled for an eligible isolated position, the feature can automatically use available balance to add margin as the position approaches liquidation, subject to its conditions.
The feature does not guarantee that the position will recover. It also does not remove the risk of liquidation. Instead, it provides another tool for managing margin when timing may matter.
Better Visibility Does Not Mean Lower Risk
Margin tools are useful only when traders understand what they show and what they cannot do.
Before using them, traders should consider:
- The amount of margin assigned to the position
- The selected margin mode
- The current liquidation distance
- Available balance
- Market volatility
- The conditions attached to Auto Margin Top-Up
A position can still move sharply even when the trader has access to more information or additional margin tools.
The Bigger Point
Futures trading is not only about choosing an entry price.
It is also about understanding what happens after the position is opened, how margin changes, how much room remains and what actions may be available if the market moves against the trade.
With live margin health and liquidation-distance tracking, isolated and cross margin, and Auto Margin Top-Up, Cosmic.trade brings several of these risk-management considerations closer to the moment they matter.
The key question is not only:
“Is my position still open?”
It is:
“How much room does my position have and do I understand the risks before that room becomes smaller?”